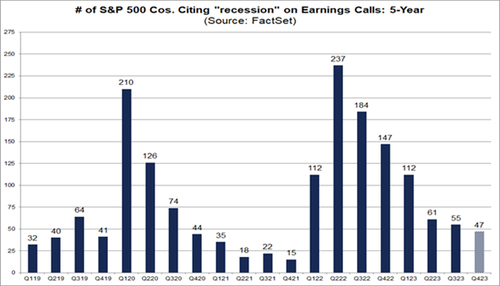
In recent months, there has been a decline in recession concerns among US corporations. Only 47 of the S&P 500 companies mentioned "recession" during Q4 earnings calls, below both the 5-year and 10-year averages. This marks the lowest level since Q4 2021. Despite peaking in Q2 2022, mentions of "recession" have decreased quarter-over-quarter for six consecutive quarters. The Financials and Industrials sectors had the highest number of companies citing "recession" in Q4 earnings calls.
In that context, there are at least five potential ‘’angry birds’’ in financial markets that could lead to increased volatility over the coming months.
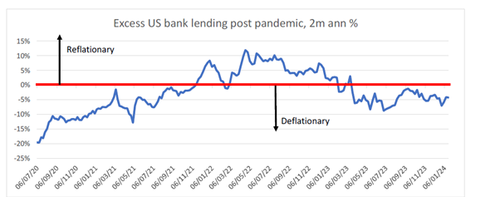
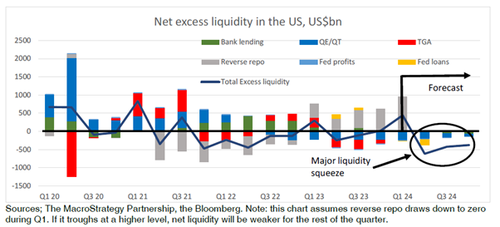
The first issue revolves around liquidity as the shadow liquidity injections related to the BTFP and RRP is expected to taper in the coming weeks. Discussions at the March meeting could suggest a gradual reduction in Quantitative Tightening (QT), aiming to reach zero by Q1 2025. However, with higher inflation persisting, the FED may decide to delay the discussion about the balance sheet size until after the summer or even the presidential election. Bank lending needs to grow at 6% to support a 2% real and 4% nominal economy. However, with bank lending currently flat, there's a $240 billion liquidity shortfall. If lending slows further as expected, the shortfall could reach $250 billion by mid-year.
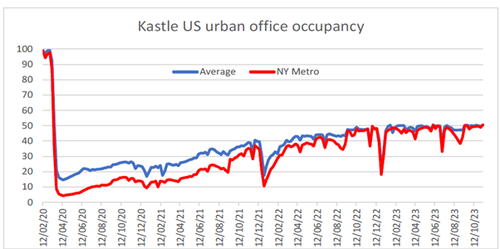
Many small banks are still scaling back loans and increasing cash reserves. NY Community Bancorp notably raised provisioning for office and multifamily loan assets as its assets exceeded $100 billion, subjecting it to stricter regulations. This trend suggests that smaller regional banks, often overlooked, may need to provision more for their commercial real estate loans, particularly those with high exposure to office and CRE assets of lower quality. Regulators may tighten scrutiny on these banks, possibly leading to an additional slowdown in lending. The persistent issue lies in office occupancy, stabilizing at around 50% over the past 18 months, prompting a reassessment of office space needs and pricing by corporates, likely to extend over the next 3-4 years.
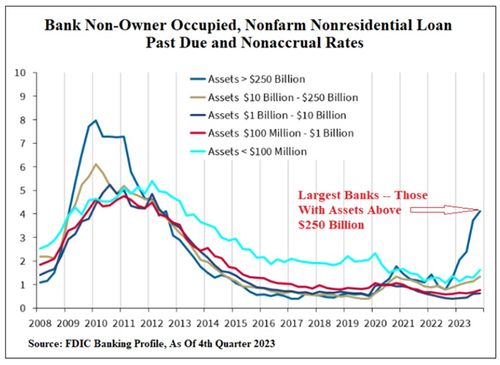
The impact of the commercial real estate crisis extends beyond just small banks. The latest quarterly update from the FDIC suggests that while the FED aims to reassure investors that the CRE crisis is contained within some US regional banks, the reality differs. Past-due loans on commercial real estate at the largest banks, as of December 31 last year, stood at 4.11%, marking a 1.66% increase compared to the end of the fourth quarter of 2008, during the financial crisis when banks faced significant challenges.
Since July last year, the Treasury's accelerated issuance led to yield tension at the front end of the curve and reduced funds in reverse repo. This trend persists, but the latest Treasury issuance program is shifting towards longer tenors, potentially slowing the drawdown in reverse repo. Once the reverse repo program has been drained (most likely by end of April), markets could face a significant liquidity shortfall.
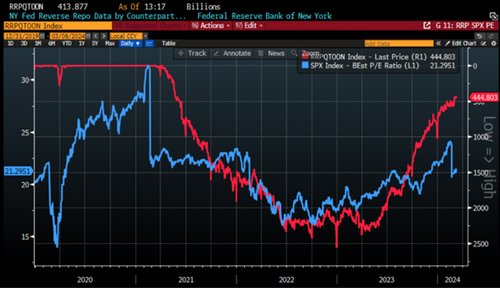
Investors will recall that the injection of shadow liquidity from the Reverse Repo Program has likely been the primary catalyst for the most hated equity market rally over the past 18 months. Historically, the RRP has provided significant tailwinds for valuation expansion in the S&P 500 during this period.
S&P 500 12-month Forward P/E (blue line); Reverse Repo Program (axis inverted; red line).
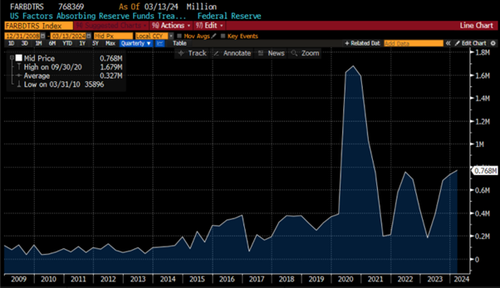
In the context of the US presidential election, Yellen could potentially draw down the Treasury General Account (TGA) to inject additional liquidity. Front-loading issuance to the front end of the curve attracted bids from Money Market funds seeking higher yields on bills than on reverse repo. Currently, the target for Treasury cash is $750 billion for end March and end June, while the current level is $767 billion. The Treasury Borrowing Advisory Committee intends to maintain the TGA at the $750 billion level going forward. The debt ceiling limit returns on January 1st, 2025, likely prompting the next sustained drawdown. Although legally permissible, Yellen drawing down the TGA to boost liquidity would be seen as another political trick to buy time until the US Presidential election..
US Treasury General Account.
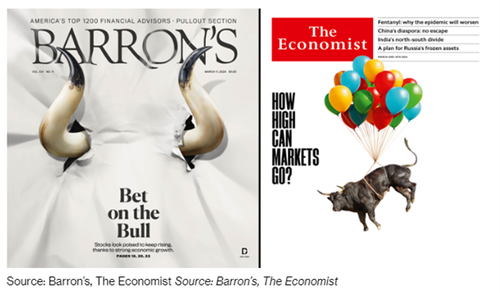
Investors know that markets do not move in straight lines, and while this cycle is far from over, they are still likely to rise, although gains will be harder to come by and more modest. Investors should remember that strong economies rarely correlate with strong financial markets. Therefore, investors need to be cautious of the latest The Economist and Barron's headlines. Not only do policymakers grow wary of further stimulus, but businesses increasingly redirect funds away from finance and into industry. The best hope for higher asset returns lies in a sluggish world economy that policymakers are attempting to stimulate. However, there remains doubt as to whether US and Chinese policymakers, the key players, will err in the coming weeks by removing shadow liquidity.
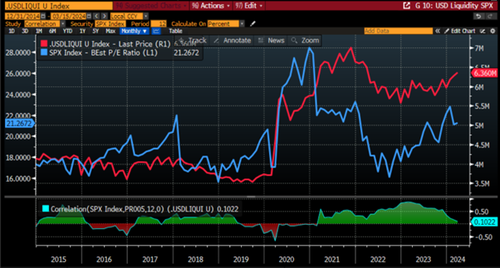
With the USD liquidity index remaining stagnant over the past few months, there are evidently fewer tailwinds supporting the valuation expansion of the S&P 500 to continue further, unless additional shadow liquidity is injected into financial markets ahead of the presidential election.
S&P 500 P/E (blue line); USD liquidity proxy index (red line) & Correlation.
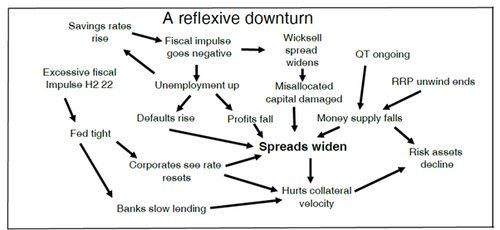
Second, credit conditions are poised to worsen. Presently, credit conditions are very accommodating. However, ongoing corporate debt resets, with around 10% of corporates transitioning to new higher rates every six months, along with tightening liquidity from Q2 2024 and the significant decline in nominal growth as the fiscal impulse turns negative, will all adversely affect credit in various ways. The continuous increase in debt payments will reduce interest coverage, as will rental renewals in commercial real estate. Tightening liquidity will diminish the demand for credit, while the loss of fiscal impulse will significantly decrease profits, further weakening credit fundamentals. The concern is that these factors may begin to reinforce each other, exacerbating the situation.
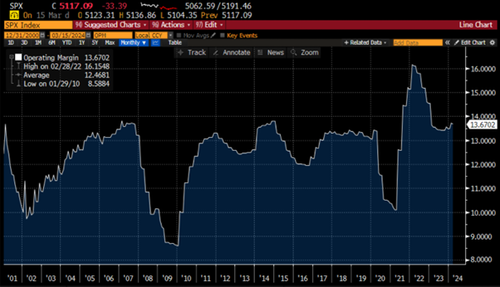
Currently, operating margins of US corporates have declined from the highs of late 2021 due to reduced capacity utilization and an inverted yield curve. If the economy is slowing down, the index will likely deteriorate further in Q2 and beyond in 2024. This decline will be driven by increasing high yield spreads and a stronger dollar, coupled with a further decrease in capacity utilization, outweighing any impact of rising unemployment on wage pressure.
S&P 500 operating margins.
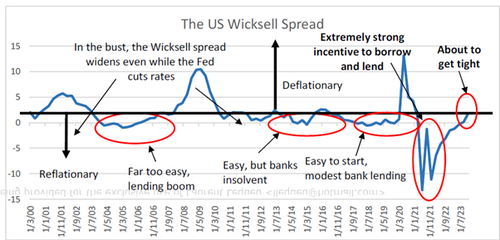
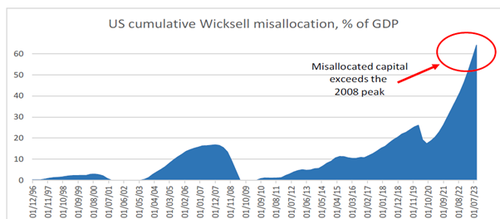
The third issue is misallocated capital. Knutt Wicksell proposed that the neutral rate of interest was approximately 2% above nominal GDP growth. When the Wicksell spread reaches 2%, firms tend to allocate capital efficiently: those unable to generate returns above this rate tend to shrink, while those capable of borrowing, investing, and growing do so. By implementing QE and maintaining rates at zero through Q4 2021, when nominal GDP was at 12%, the FED orchestrated the most significant Wicksell stimulus to date.
When the Wicksell spread falls below 2%, particularly reaching -13% as it did in 2021, it encourages firms and individuals to leverage up, buy assets, and invest heavily, assuming that the easy liquidity environment will persist indefinitely. However, later in the economic cycle, as interest rates increase, growth slows, and spreads widen, the Wicksell spread surpasses 2%. At this juncture, misallocated capital is eroded, and the equity and debt supporting it suffer impairment. Due to the exceedingly aggressive nature of the Wicksell stimulus during the pandemic—arguably the most aggressive in our lifetimes, the level of misallocated capital is now unparalleled and probably mostly invested in AI and CRE related businesses.
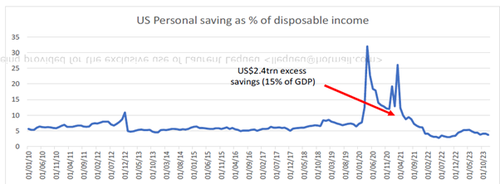
The challenge with the Wicksell spread during a downturn is that it's challenging for the FED to lower it below 2% while the economy slows. Even if the FED initiates gradual cuts, such as those expected by the market, the loss of fiscal impulse may impact nominal GDP growth more significantly. Additionally, tightening liquidity can increase credit spreads, potentially overwhelming the effect of quarterly rate cuts. This scenario could lead to a rising Wicksell spread even during FED rate cuts, further pressuring misallocated capital, deterring corporate investment and hiring, and prompting increased discretionary savings. Another significant concern for the US economy is the current savings rate at 3.7%, compared to 7.5% pre-pandemic, suggesting a lasting impact on savings behavior.
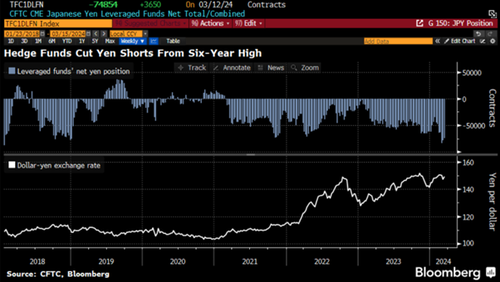
Fourth, Japan, which has been a liquidity provider in recent years, is anticipated to witness the Bank of Japan adjusting its Negative Interest Rate Policy and ending the Yield Curve Control policy at its March 19th meeting due to heightened wage increases and persistent inflation pressures. Ending the NIRP will likely prompt hedge funds to reduce their Yen short positions, resulting in a strengthening of the Japanese currency.
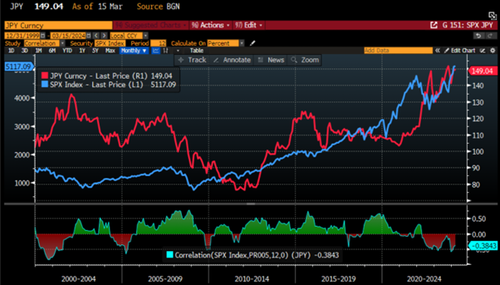
For equity investors, the unwinding of the notoriously popular carry trade could indicate that a sustained strengthening of the Japanese currency would present a significant headwind for markets in the coming months.
S&P 500 index (blue line); JPY/USD FX rate (red line) & Correlation.
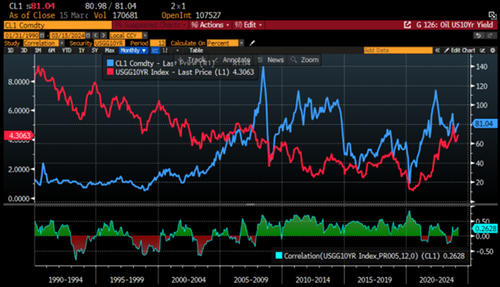
Finally, the recent rebound in oil prices, largely driven by supply constraints, will not only serve as a significant catalyst for an inflation rebound in the next few months but also pose an additional headwind for consumers already strained by persistently higher interest rates.
WTI prices (blue line); US 10-Year Yields (red line) & Correlation.
Read more and discover how to position your portfolio here:
https://themacrobutler.substack.com/p/the-5-angry-birds-to-watch-ahead
At The Macro Butler, our mission is to leverage our macro views to provide actionable and investable recommendations to all types of investors. In this regard, we offer two types of portfolios to our paid clients.
The Macro Butler Long/Short Portfolio is a dynamic and trading portfolio designed to invest in individual securities, aligning with our strategic and tactical investment recommendations.
The Macro Butler Strategic Portfolio consists of 20 ETFs (long only) and serves as the foundation for a multi-asset portfolio that reflects our long-term macro views.
Investors interested in obtaining more information about the Macro Butler Long/Short and Strategic portfolios can contact us at
Unlock Your Financial Success with the Macro Butler!
Disclaimer
The content provided in this newsletter is for general information purposes only. No information, materials, services, and other content provided in this post constitute solicitation, recommendation, endorsement or any financial, investment, or other advice.
Seek independent professional consultation in the form of legal, financial, and fiscal advice before making any investment decisions.
Always perform your own due diligence.

